Most marketing companies show you their best screenshot. One week where CPL was $40. One client who crushed it. One campaign that looked incredible on day 3.
We could do that. Our best-performing ads run at $60.96 CPL. We have clients at $45 CPL in large multi-state campaigns. We could cherry-pick all day.
Instead, here's what $78 cost per lead actually looks like when you track it honestly across every client, every week, including the bad ones.
The Full Picture: March 2026
Data through March 19, 2026. 26 client accounts. 351 active ads. $175,470.75 in total managed ad spend.
The averages:
- $77.71 overall cost per lead
- 2,258 total leads generated
- $87.23 overall CPM (cost per thousand impressions)
- $11.01 overall cost per click
- 0.79% overall click-through rate
- 7.06 link clicks per lead (it takes about 7 clicks to generate 1 lead)
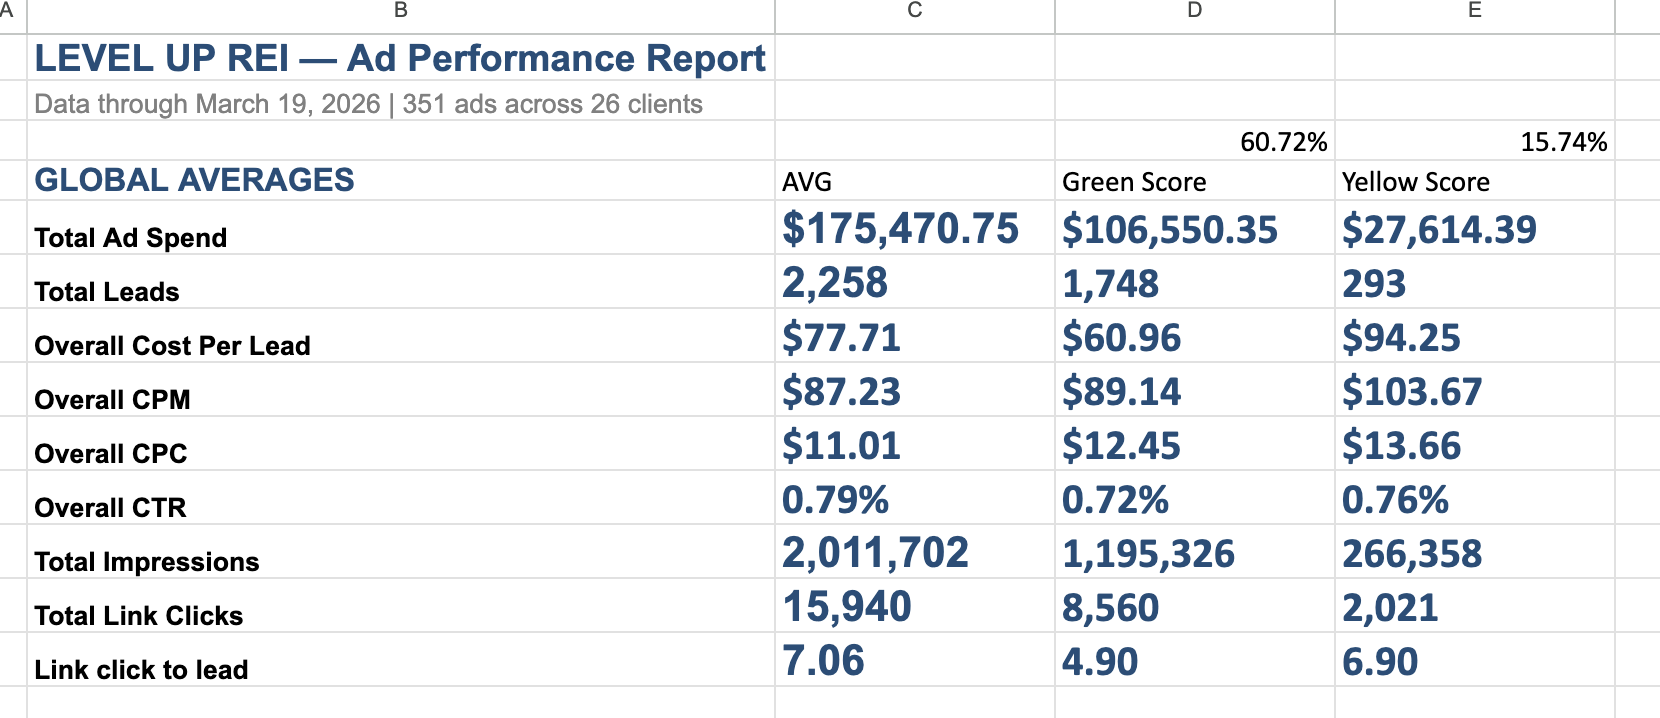
The breakdown by performance tier:
Green Score ads (60.72% of all ads): $60.96 CPL. These are the winners — the ads that found the right audience with the right message. They account for the bulk of our lead volume and deliver the best quality.
Yellow Score ads (15.74% of all ads): $94.25 CPL. These are underperforming but not dead. Some are being tested. Some are in markets with smaller population where CPL is naturally higher. Some need creative refreshes.
The remaining ~24% are either new tests, paused, or recently launched and don't have enough data to score yet.
This is real. We don't hide the yellow. We don't pretend every ad crushes it. 60% of our ads perform above benchmark, 16% underperform, and the rest are in testing. That's what an actively managed portfolio looks like.
Why We Show You the Bad Weeks Too
Here's something from one of my early emails to our list that sums up how we think about transparency:
Our CPL shot up during the week of Christmas and New Year's — that happens to every single marketing channel. I could have just shown a screenshot from when CPL was at its lowest. But the reason we have good results for our clients is because we're transparent, and openly talk about when we have problems or issues.
Holiday spikes, seasonal fluctuations, accounts that need fixing — we talk about all of it. Because that's how you actually fix things. If your marketing partner only shows you the good news, they're managing your perception, not your account.
What Happens Behind the $78 Average
That $77.71 number is the output of a system running 24/7. Here's what's happening under the hood:
50+ new ad creatives produced per month. Not recycled. Not slightly edited. New scripts, new actors (real and AI), new pain angles, new hooks. Facebook wants fresh content every 2 weeks or your ads fatigue and CPL rises.
Ads graded by quality, not just cost. We track which ads produce leads that actually convert to contracts — not just which ads produce the cheapest leads. An ad at $90 CPL that converts 1 in 12 is more valuable than an ad at $45 CPL that converts 1 in 35. We shift budget accordingly.
Account reviews 3x per week minimum. Monday: CPL report and lead quality feedback request. Tuesday and Thursday: full team review of every account. Custom ads filmed for problem accounts. Budget shifted from losers to winners.
Lead form filtering active on every account. Listed properties removed. Non-owners removed. Unwanted property types removed. 2-factor phone verification on every lead. This filtering is what keeps the $78 CPL meaningful — because those leads are real people with real phone numbers who actually want to sell.
Algorithm management. We monitor for audience expansion drift (when Facebook broadens targeting too much and quality drops). When we see it, we reset campaigns and tighten back up before it impacts the client.
The $78 average is the result of all of this working together. It's not a number that happens by accident — and it's not a number that stays low without constant effort.
What $78 Per Lead Actually Costs You Per Deal
The CPL is just the input. Here's what it produces:
At $77.71 CPL and 1 in 15–20 leads to a contract:
- Cost per contract: $1,165–$1,554
At our best client (1 in 6 leads to contract):
- Cost per contract: $466
At our worst-performing range (1 in 25 at $94 CPL):
- Cost per contract: $2,350
On a $20k average deal size:
- Average ROI: 13–17x
- Best case: 43x
- Worst case: 8.5x
Even the worst case is profitable. That's the power of a system that optimizes for lead quality AND cost simultaneously.
How We Value Transparency (And Why It Matters for You)
I'll say what I always say: if someone can prove they get better average client results than we do, you should work with them. I mean that sincerely.
But when you're evaluating, ask for the same level of transparency. Not their best week. Not one client's results. Their average — across all clients, including the ones that are still ramping up, including the accounts they're actively fixing.
Most companies won't show you that because the average isn't impressive. Ours is — because we've built the system to produce consistent results, not spiky ones.
We don't sugarcoat anything. If your systems and marketing suck, we tell you. If we need to fix something on our end, we tell you that too. That's why our clients actually get results and stay for an average of 19–20 months.
No setup fee. No minimum commitment. Month to month. We earn your business every month.
If you want to see what your specific CPL would look like and how these numbers translate into deals for your business, book a strategy call.
Book a Free Strategy Call →Chandler Saine | CEO of Level Up REI
leveluprei.io
We've helped 43 companies scale to $100k/month. 100+ five-star reviews. Clients doing 20 to 300 deals per year. $200k+/month in managed ad spend across 26 accounts.